11.3B+
Trade Records
ShipScout maps every supplier in your category by country, volume, and trade lane. Spot rising origins before your competitors do, whether that's Vietnam taking furniture from China or Mexico taking auto parts, and build a multi-region sourcing strategy on customs-grade evidence.
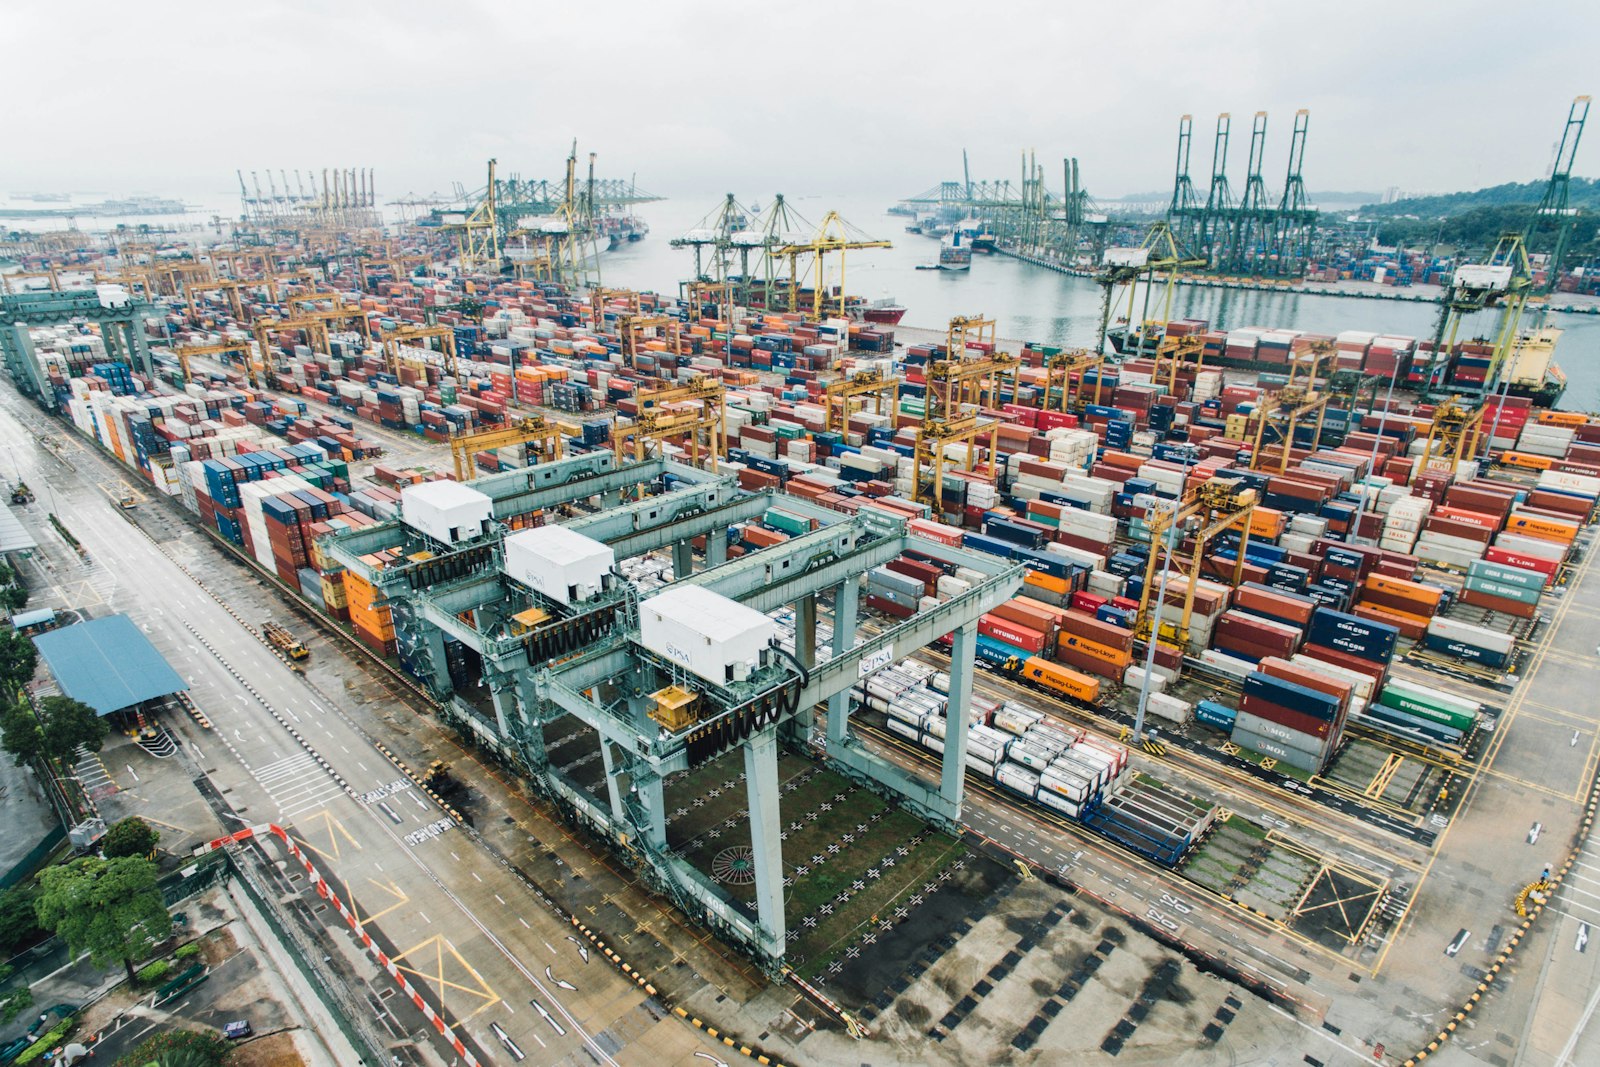
Category managers don't need another supplier list. They need a map : every exporter on the planet, sorted by HS code, ranked by volume and plotted by trade lane. That map is what lets a sourcing team make a defensible call when leadership asks: "If China gets harder, where do we go?" ShipScout is that map. 11.3B+ customs records, 17.6M+ verified suppliers and 150+ origin countries, indexed and searchable by category in seconds.
Pick an HS code. ShipScout returns every factory that has shipped under it in the last 36 months, sorted by export volume, plotted on a country heatmap and broken down by destination market. For a furniture category manager, HS code 9403.60 (wooden furniture) instantly surfaces 4,200+ active exporters across China, Vietnam, Indonesia, Malaysia, Poland, Italy, and Mexico. For automotive HS code 8708.29 (vehicle body parts), you see Germany, Mexico, Czech Republic, Turkey, and an emerging Indian cluster around Pune.
This isn't an industry directory scraped from trade-show lists. Every supplier is tied to declared customs data: a real bill of lading, a real container, a real CIF/FOB price. Sourced from US Customs CBP, EU Eurostat, and port registries; India trade flows are delivered via licensed mirror sources.
Between 2018 and 2025, Vietnamese furniture exports to the US grew 312% while Chinese furniture exports to the US fell 41%. Sourcing teams that read that signal in 2020 locked in capacity at Binh Duong factories at 2020 prices. Teams that waited until 2024 paid 60% more and got allocated leftover capacity. ShipScout's origin-country trend graphs are built for this: the year-on-year shift by HS code and destination market, well before the trend pieces get written.
Mexico overtook China as the largest US trading partner in 2023, driven heavily by automotive parts and electronics nearshoring under USMCA's regional content rules. ShipScout shows which Mexican states (Nuevo León, Coahuila, Guanajuato) are ramping which HS codes, and which Tier 2 and Tier 3 suppliers in those clusters have spare capacity.
India's electronics exports doubled between 2020 and 2024 on the back of Apple's iPhone manufacturing shift to Tamil Nadu and Karnataka. Pharma APIs and specialty chemicals are riding a similar wave. ShipScout indexes India's full export dataset via licensed mirror sources, so a sourcing team looking for an Indian alternative to a Chinese supplier gets a ranked list in minutes, not a six-week consulting sprint.
Every category-sourcing review since 2022 has had a slide titled "China+1." Most stop at the slide. ShipScout operationalizes the strategy. For each high-exposure category:
What used to be a quarterly McKinsey deliverable is now a Tuesday-afternoon dashboard.
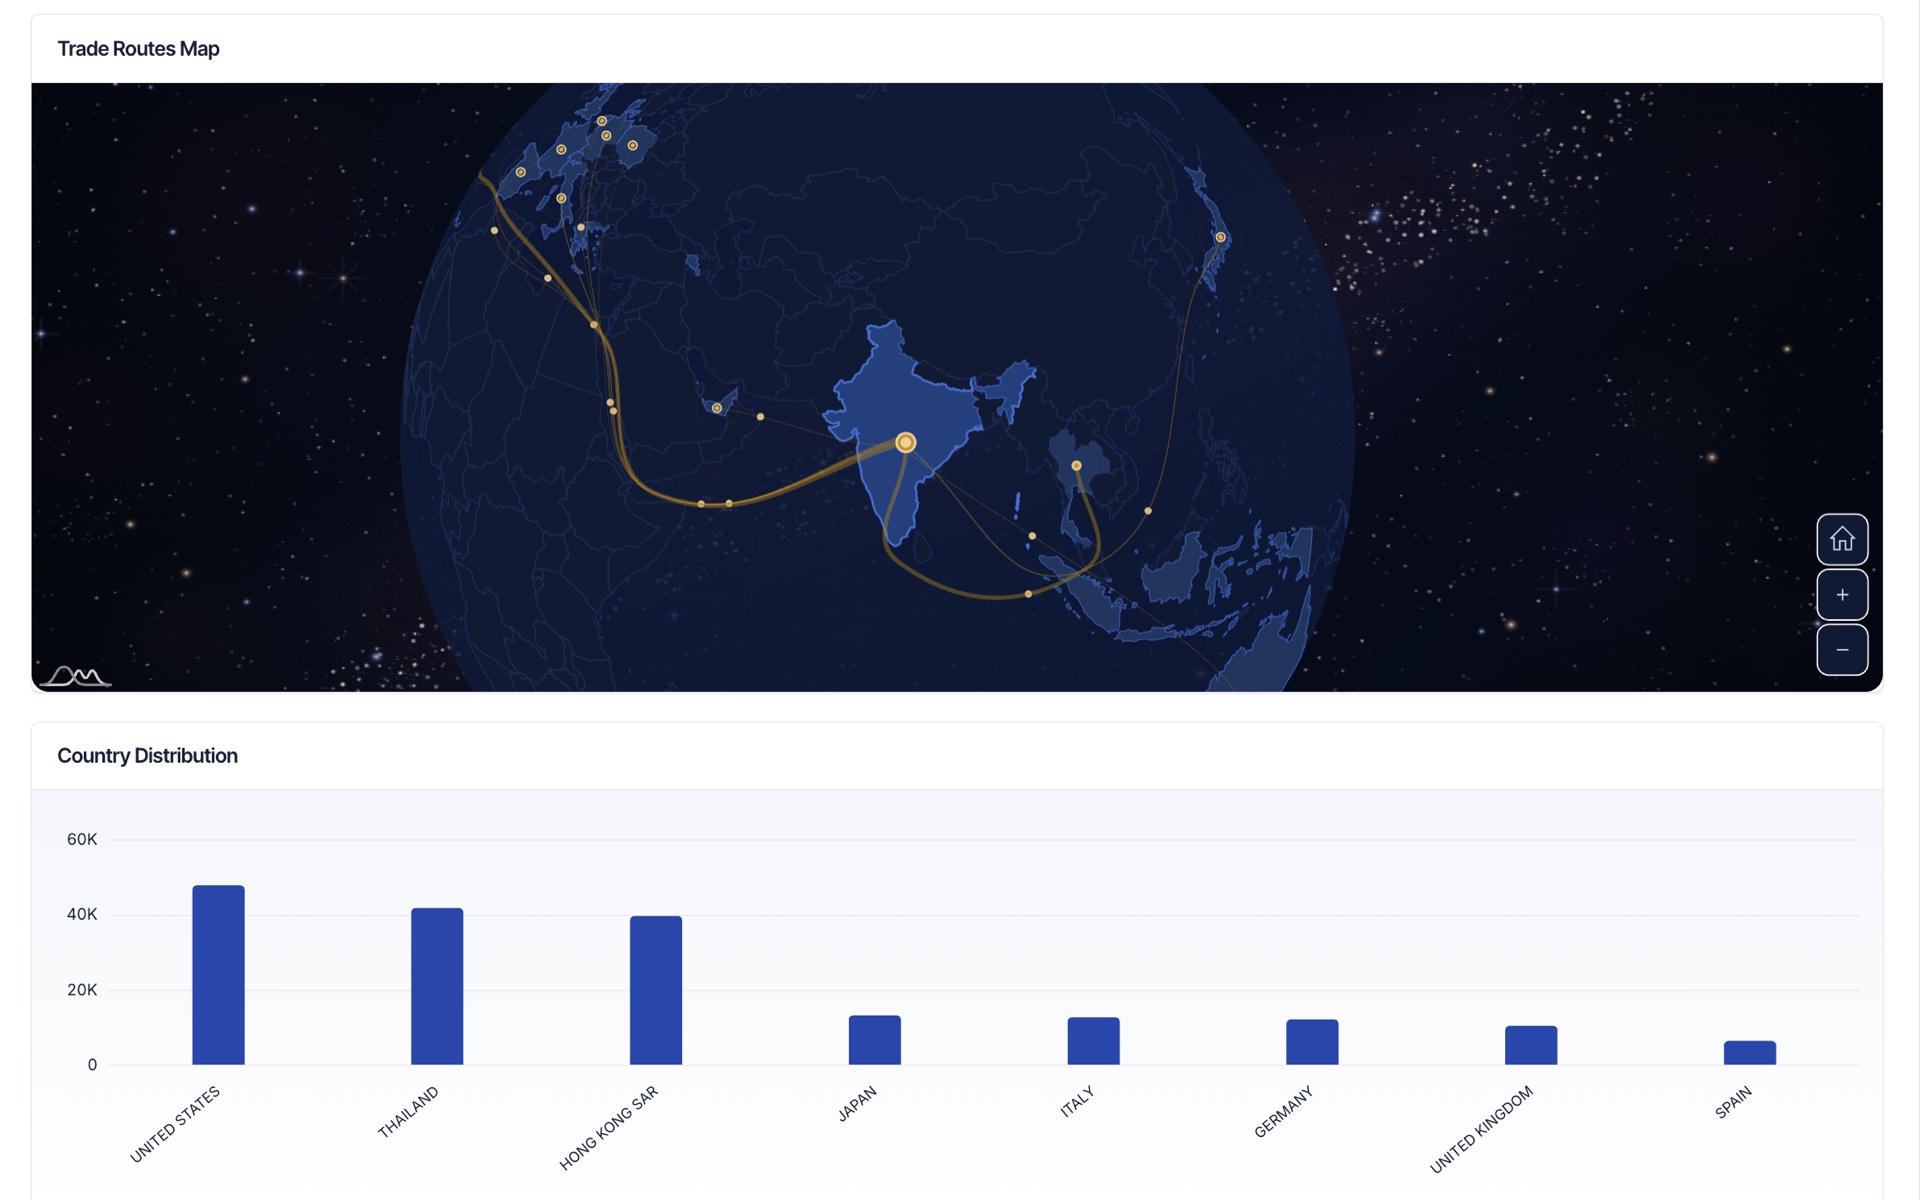
Visualize every exporter in a category on a global heatmap. Click country = supplier list.
YoY export growth per origin country, per HS code. Spot rising origins 12-18 months ahead.
One-click alternative origin lists filtered by FTA, tariff, and friend-shoring criteria.
Compare delivery cost, transit time, and tariff exposure across origin candidates.
Per-supplier reports: annual volume, customer roster, factory size, ownership.
Saved searches that refresh themselves, so new entrants and capacity shifts show up on their own.
Legacy providers sell category mapping as an enterprise contract. ShipScout does the same category mapping and origin-trend analysis at a fraction of what those platforms charge, with CRM, supplier outreach and 48-hour Contact Intelligence reports included. See pricing →
Every record on ShipScout traces back to a primary government filing. US CBP AMS waterborne manifests and ACE entries. EU Eurostat Comext for intra- and extra-EU trade. National port authorities and customs registries across LATAM, APAC, MENA, and Africa. India trade flows are delivered via licensed mirror sources. When your CFO asks where the China-substitution analysis came from, you point to a customs declaration, not a consultant's spreadsheet.
Plot every exporter by origin country and volume to answer "if China gets harder, where do we go?" with data, not opinion.
Join hundreds of exporters and importers already using ShipScout to find suppliers, track competitors, and discover new markets.