2.4M+
Daily shipments processed
ShipScout's AI ingests millions of recent customs filings every day and surfaces the products with the fastest demand growth, by category, destination or HS code. Each one gets a Trade Index Score so you know what to chase first.

Search any product for a 12-week demand trend, Trade Index Score and one-click buyer list. Organic turmeric currently scores 18/100 with +19% recent growth.
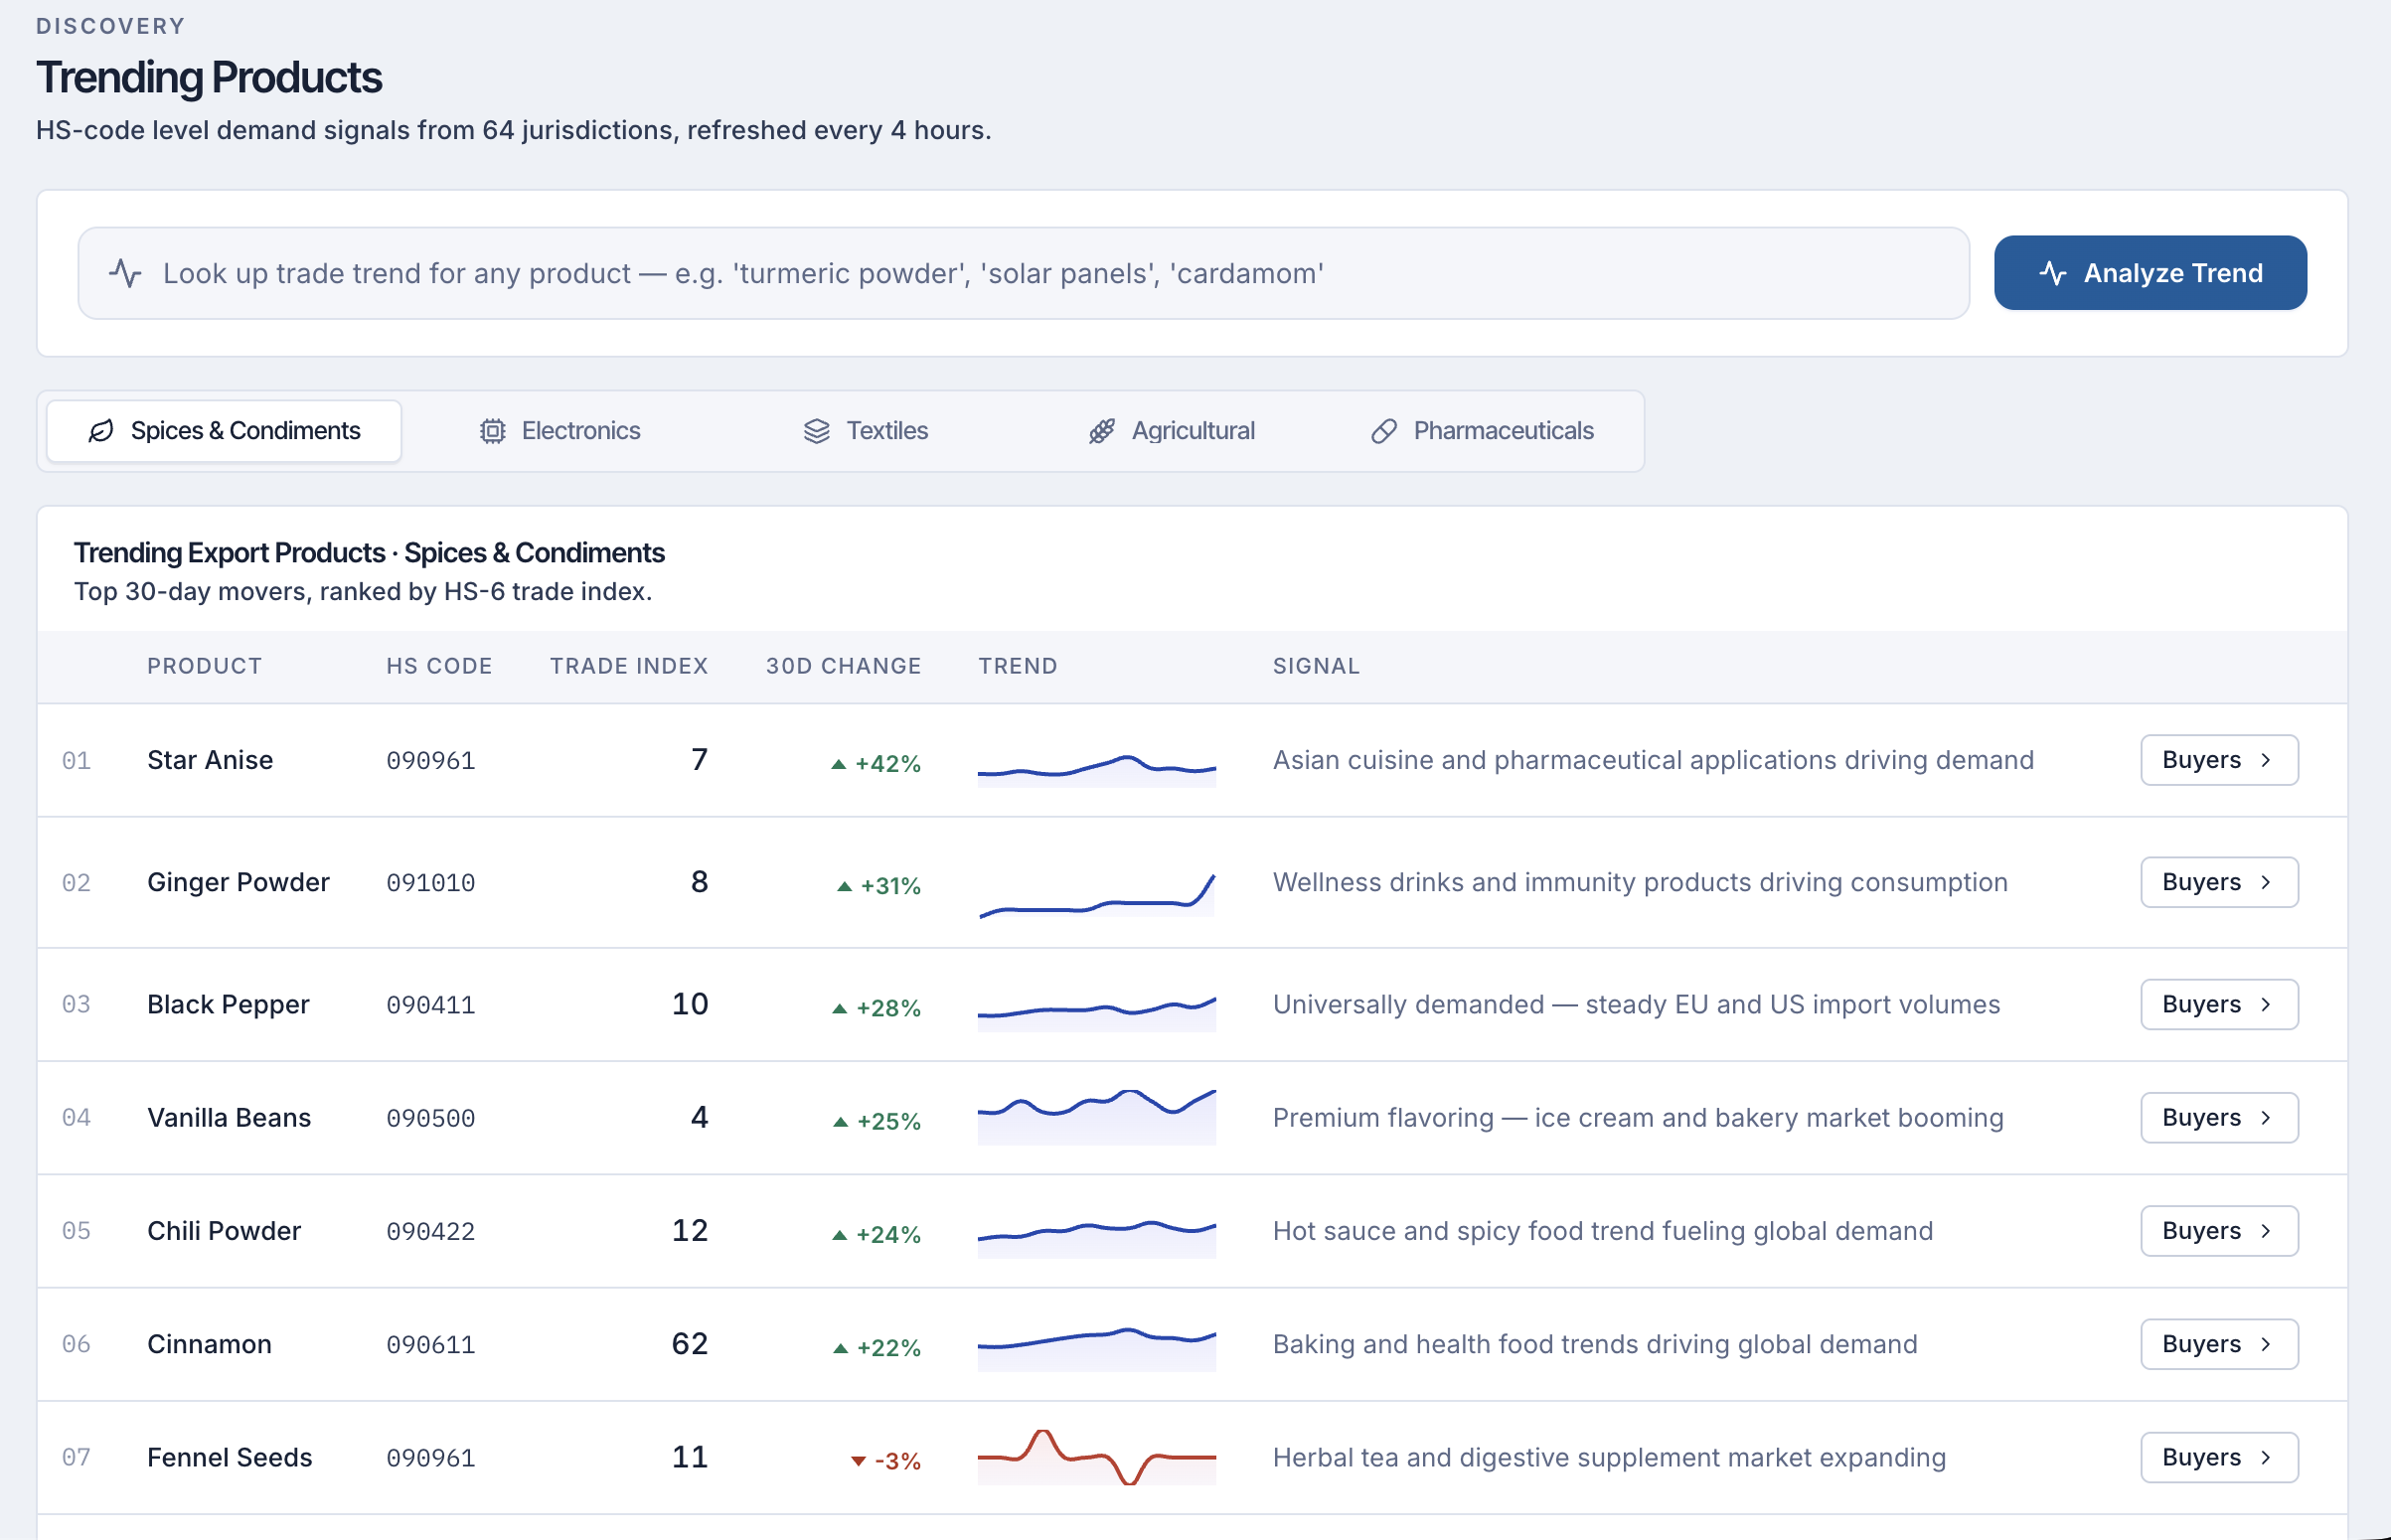
Every other trade-data platform makes you query, filter, sort, export, and squint at a spreadsheet to figure out what's growing. ShipScout flips it: open the Trending Products dashboard and the AI has already crunched 30/60/90-day customs movement, computed velocity scores, and ranked the categories where demand is climbing fastest.
Each trending product is a row with: Trade Index Score (0-100), growth percentage vs prior period, total shipment volume, top 5 destination markets, top 5 exporters, and a one-click action to open the full buyer list filtered to that product. No queries to write. No dashboards to build.
Composite score blending volume velocity, market diversification, exporter entry rate, and growth consistency. 80+ = surging.
Side-by-side 30, 60 and 90-day movement, so you can tell acceleration from a market that is simply large.
The 5 countries pulling the biggest volume right now, with month-over-month change. Targets your geography choice.
Who is winning the lane today, by volume, value and consistency. Useful for benchmarking or competitor work.
Pivot straight into the buyer list filtered to this product. Real importer names, decision-maker contacts, and ready outreach.
Reuters, Bloomberg, Kraken-API and FTA-bulletin feeds explain the why: a tariff cut, a supply-chain shift, a regulation change.
Other providers all let you query trade data. None of them tell you what's trending. You bring a hypothesis, run a search, and hope it pans out. ShipScout flips that workflow.
Three structural advantages:
March 2026: ShipScout's Trending Products dashboard scores HS 1006.30 (semi-milled / wholly milled rice) at Trade Index 91, up from 73 in January. UAE imports rose 38% month on month after the India-UAE CEPA tariff schedule reset on 1 March. The dashboard surfaces the top 22 UAE rice importers with full buyer profiles.
An Indian rice exporter in Karnal sees the alert, opens the buyer list, fires CRM AI drafts to all 22, and books 5 quote requests in week one. Two convert into recurring contracts. Total contract value Year 1: USD 1.4M. Time elapsed from spotting the trend to first booking: 11 days.
The next surging product is being shipped right now. Book a demo and we'll show you the live Trending Products dashboard for your category, scored, ranked and one click from a buyer list.
The next surging product is being shipped right now. We'll show you the live Trending Products dashboard for your category, scored, ranked and one click from a buyer list.